Business reporting dashboard / Private application
Sales Dashboard
A working view of sales and profit, with interactive charts and filters that make the numbers easier to explore.
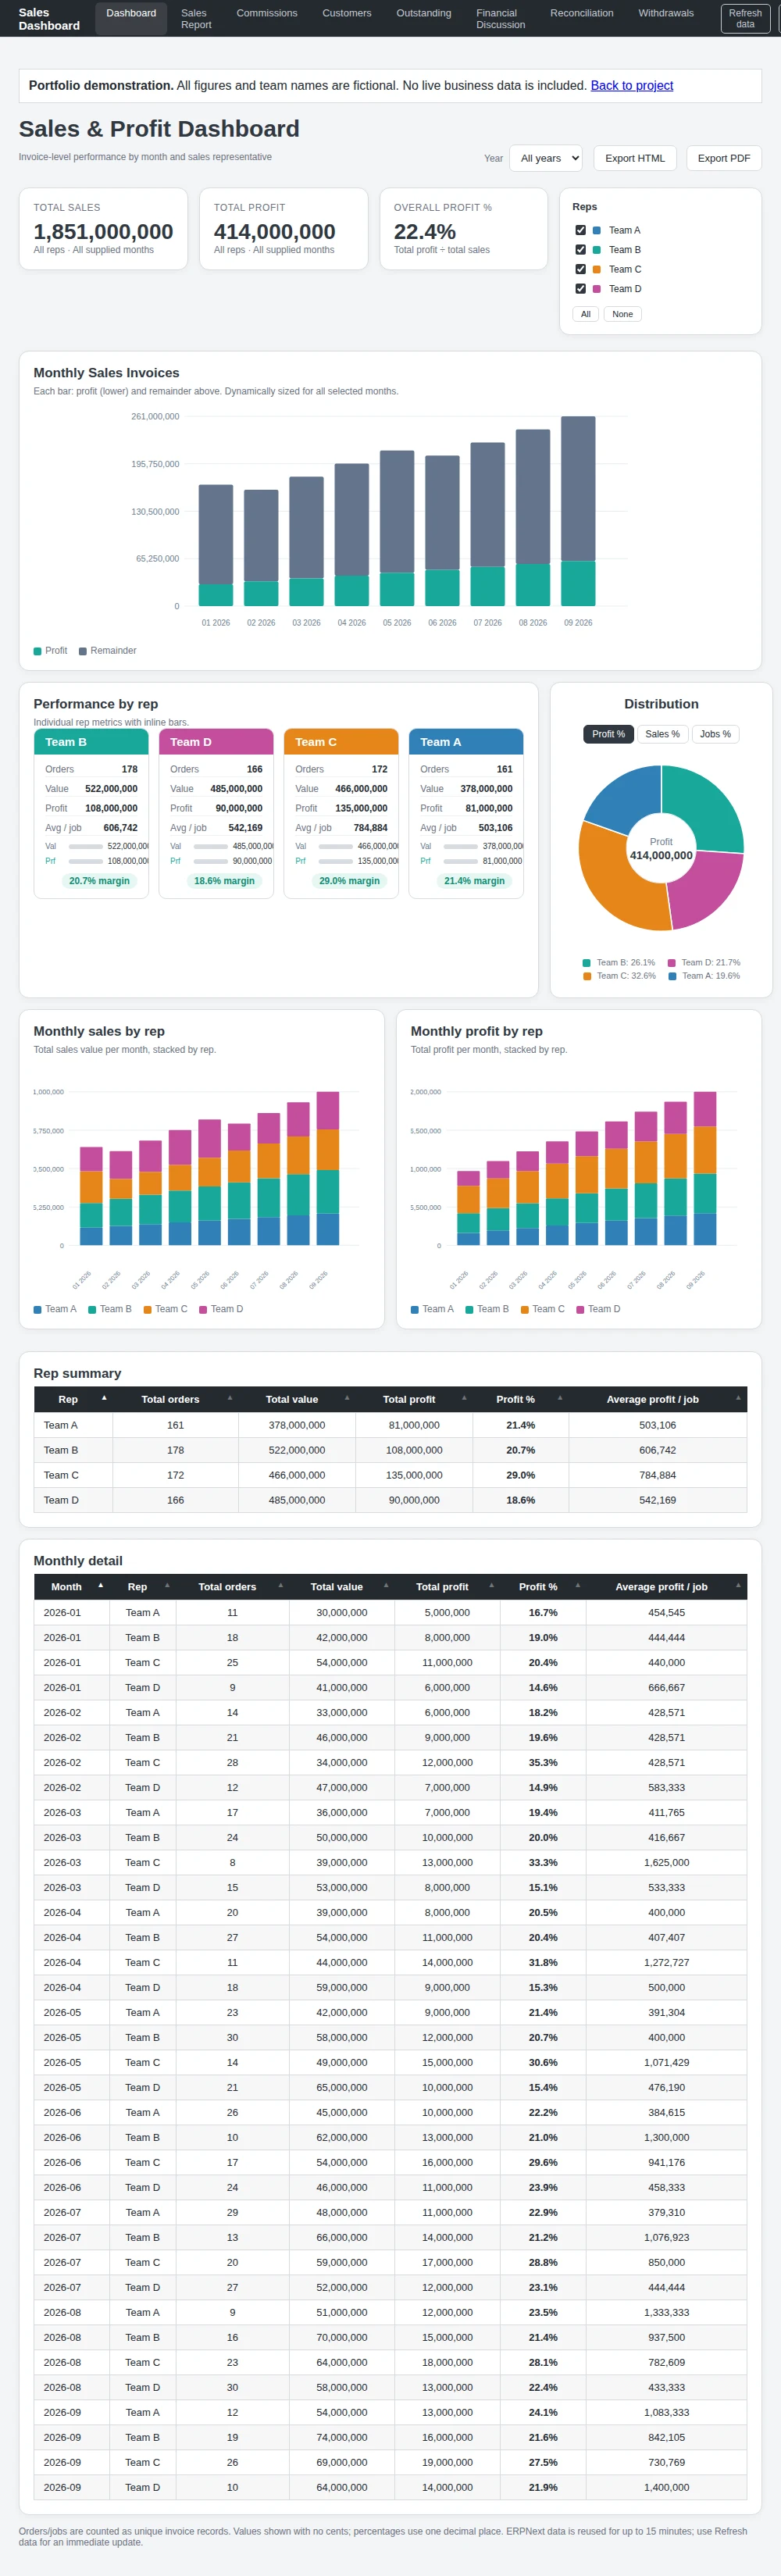
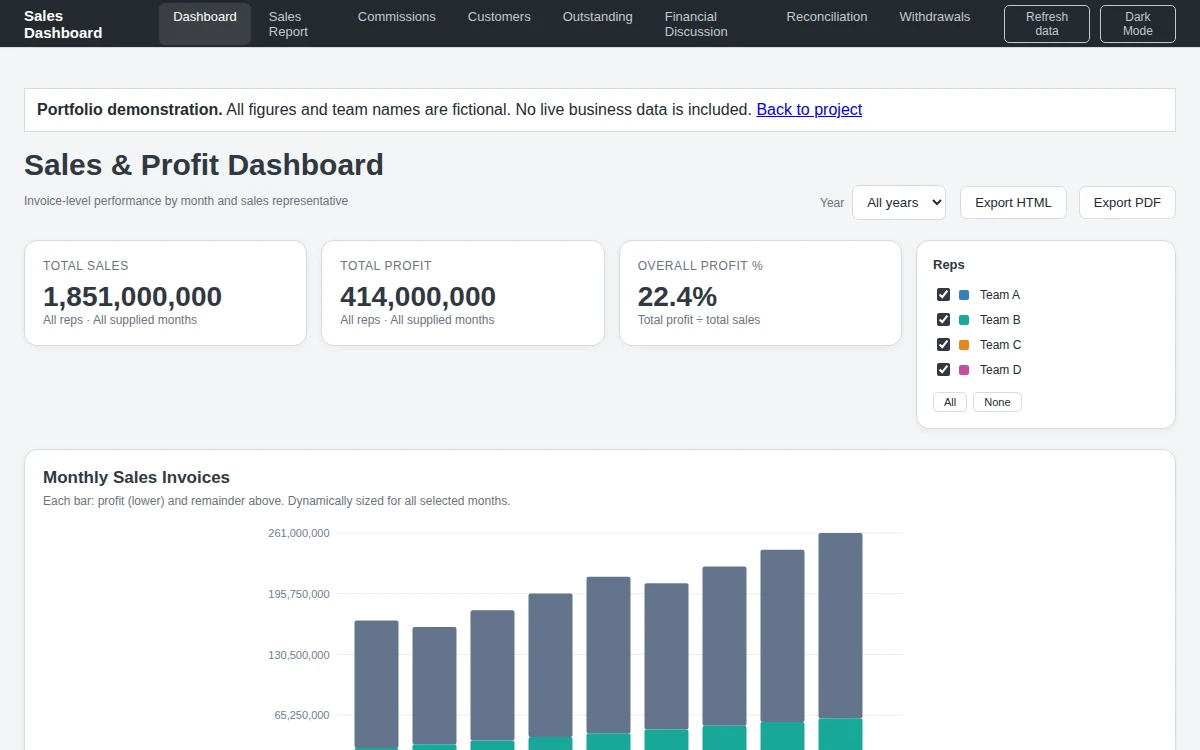
Portfolio demonstration of the actual interface, populated entirely with fictional figures and team names.
Built around the way people work.
The dashboard turns invoice-level information into monthly and team views. Filters, chart interactions and summary tables help users move from the overall picture into the detail. This portfolio version uses the actual UI with a synthetic dataset; it has no connection to the live data feed.
A clear overview
Sales, profit and activity can be read together rather than across disconnected reports.
Questions become interactions
Year and team filters redraw the charts and tables around the selected view.
A safe public demonstration
Every figure and team name in this preview is fictional. No real financial records are included.
Let’s explore what’s possible for you.
Send us your current website. We’ll build a free demo so you can see the direction before you decide.